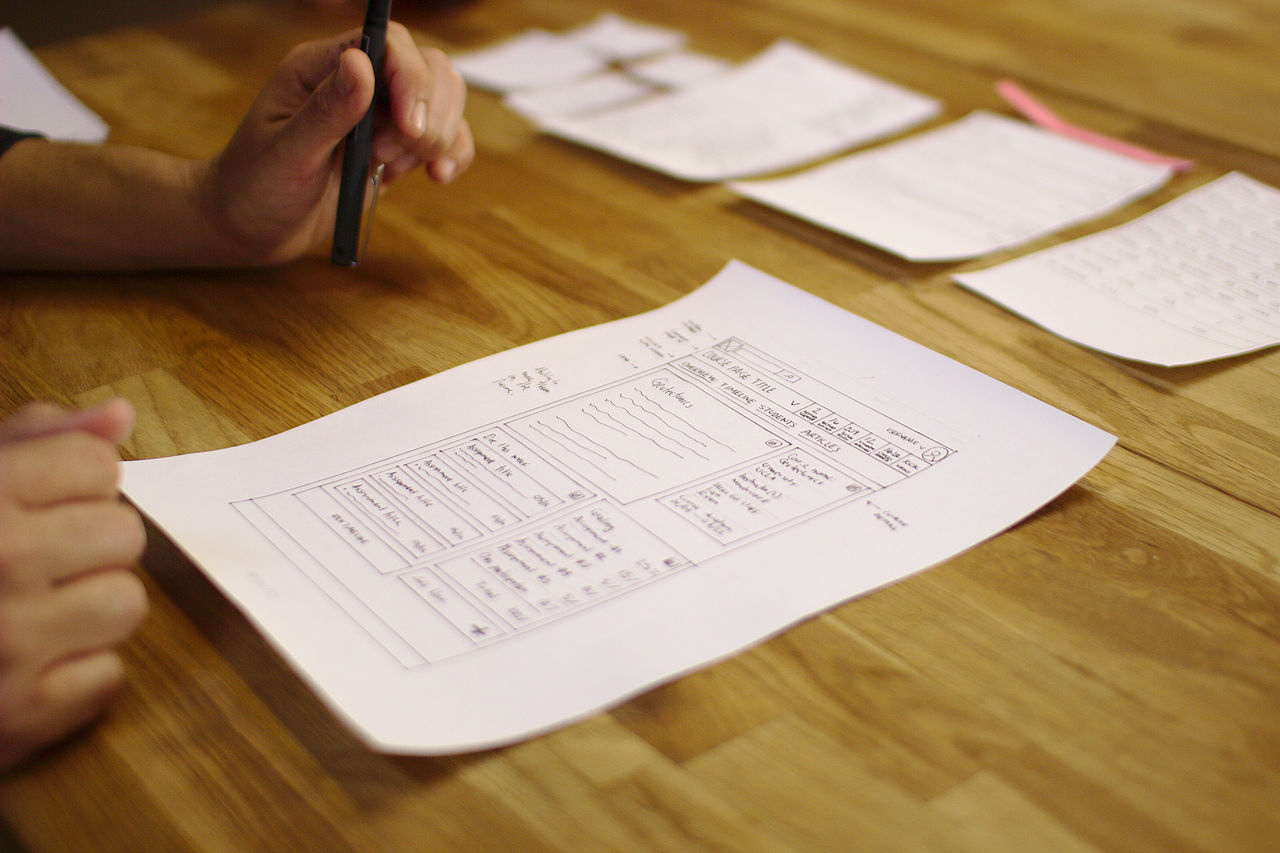
A simple static webpage or paper prototype will be made to illustrate the dashboard. The group will agree on the general theme of the dashboard.
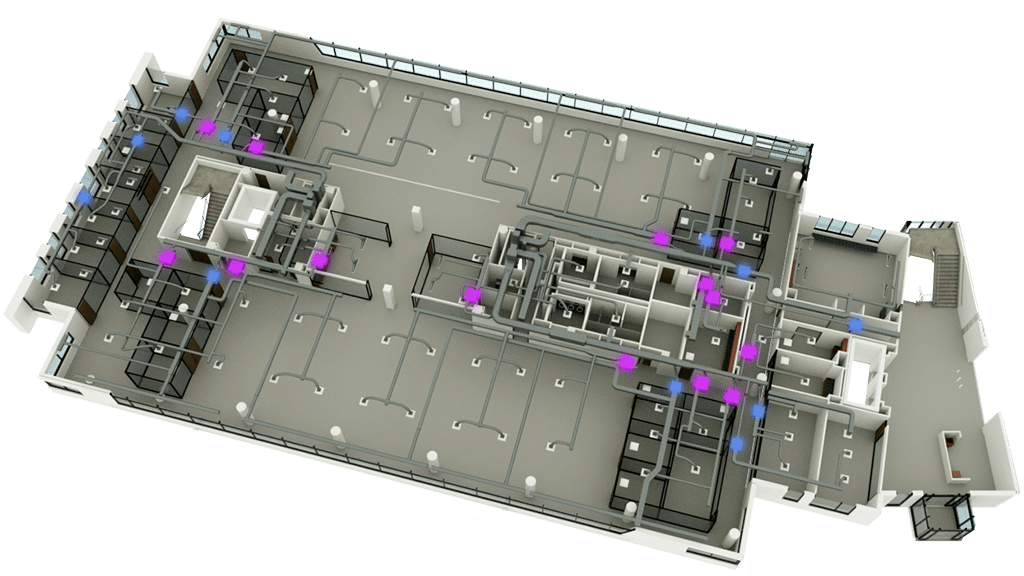
The Innovation Wing is a place for students to conduct learning activities, experiments and showcase their achievements. It is located on the G/F and LG/F of Hui Oi Chow Science Building and is going to open in April 2020. This project is about collecting, analysing and displaying the data from the Innovation Wing to provide insights into users' usage of the facility.

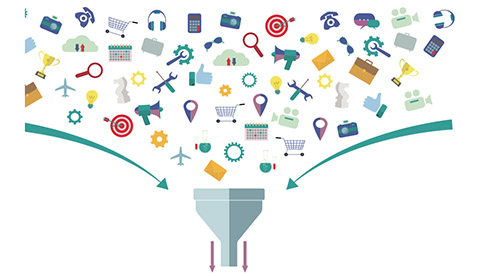
Collect the data by different means such as sensors, online system and entrance gate.

Analyze the data collected to search for any pattern or trend.

Present the analysis result on a real-time dashboard located in Innovation Wing.

Director of the Innovation Wing
We are a group of final year Computer Science students at the University of Hong Kong.
Jason
Starfish

Alvin
InnoLens will be implemented and tested according to the following timeline.
In this stage, the most basic work will be done to determine the general structure of the project.
The most challenging work will be accomplished in this stage, as to confirm whether the system is feasible.
Most of the frontend design will be completed in this stage. The project will have a user interface for most basic functions. The corresponding backend framework will be ready as well.
Other backend functions will be implemented in this stage to finalize the system.
In this stage, the system will be tested with different data, so that it can be debugged before publishing.
A simple static webpage or paper prototype will be made to illustrate the dashboard. The group will agree on the general theme of the dashboard.

The database structure will be defined, including the types of data and their relationship.
The model for electricity and air quality pattern matching will be developed and trained.

The design agreed on previous stage will be implemented. The backstage dashboard for staff will be realized.
The design agreed in previous stage will be implemented. The dashboard for users will be realized.

The analysis that requires only database operations will be implemented at the backend as well.
Different artificial datasets, including the extreme ones will be used for testing. They are used to detect calculation errors.
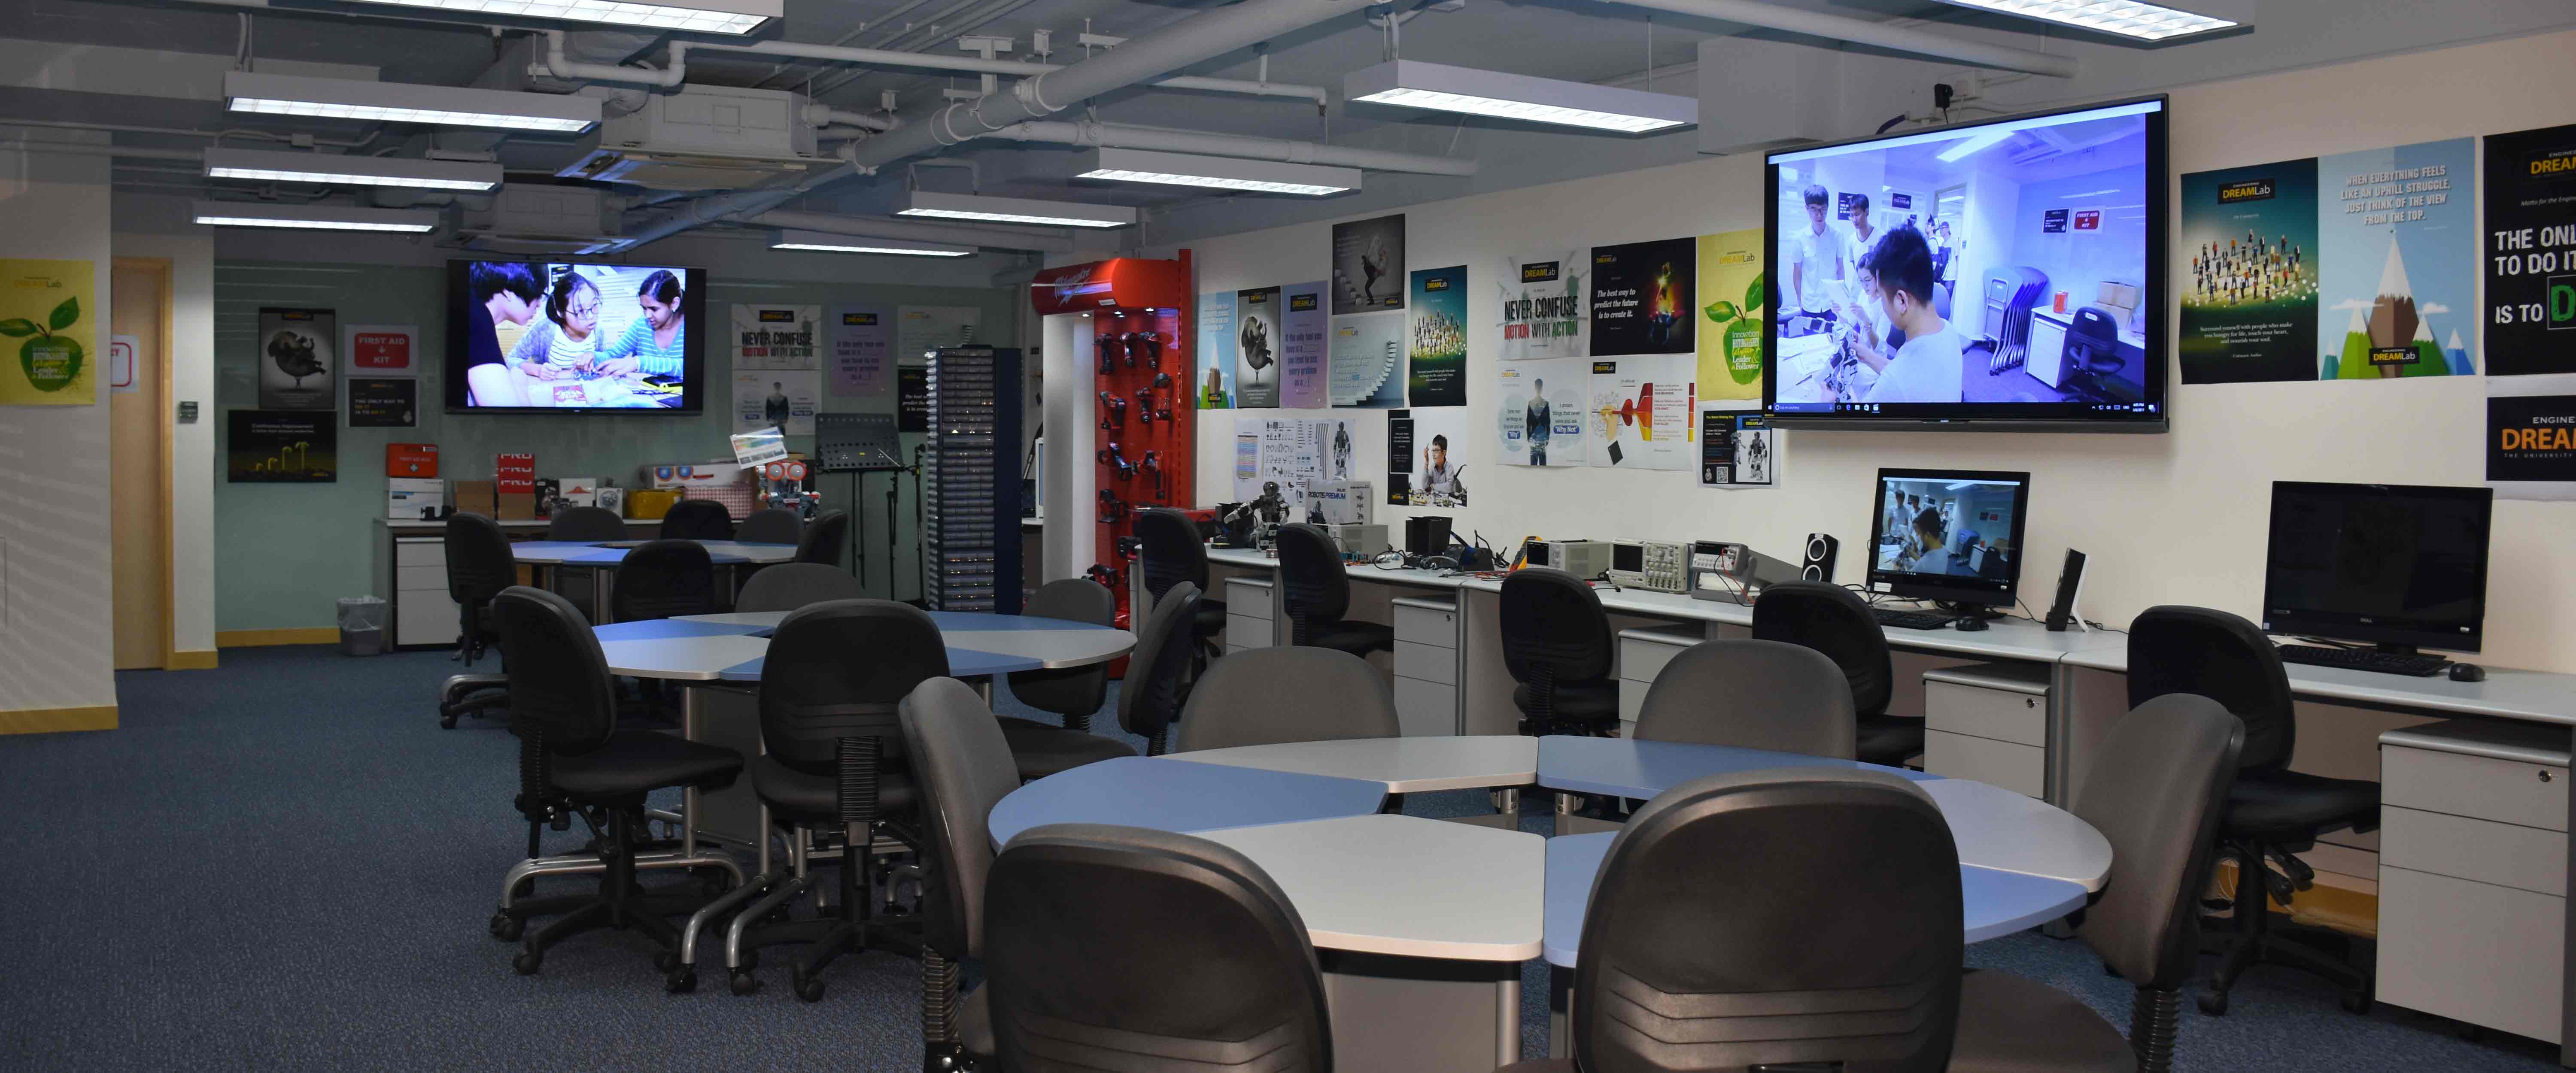
Real datasets generated by the DreamLab will be used for testing. They are used to determine whether the analysis can produce useful and meaningful information.

